Japanese
Contact

TechnoStar Co. Ltd

Search
Contact
Home > Our Products > Jupiter-Compare
Automotive
Shipbuilding
Precision Equipment
Pre-Post
Structural Analysis / Heat Conduction Analysis
Thermo-fluid analysis
Acoustic Analysis
Electromagnetic Field Analysis
Design Support / Optimization
Comparison of analysis results

Jupiter-Compare

Instantly compare CAE analysis results (within 1 second at 5 million nodes)
Visualize differences in analysis results


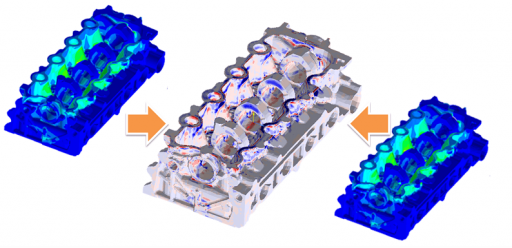
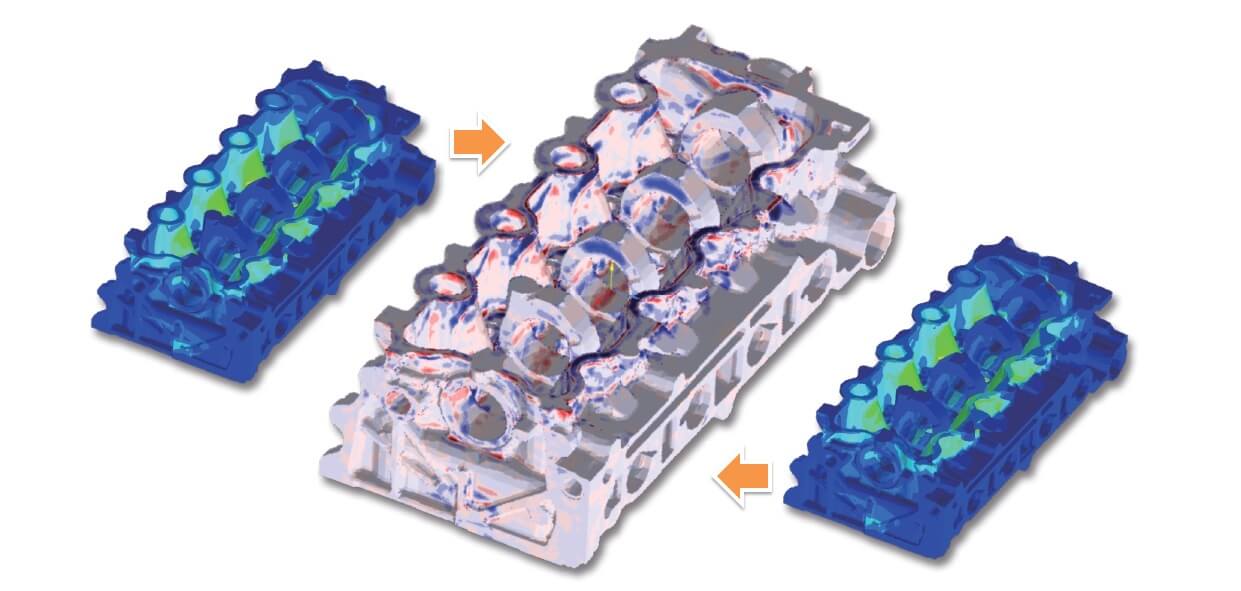
The Compare function is a next-generation CAE result comparison tool that can visualize the differences in analysis results.
By applying the latest technology not found in the field of finite element method (FEA), we will bring a breakthrough in post processing.

If users execute the Compare function after contouring the two analysis results, a difference contour model of the analysis results will be created instantly.
Since the difference contour model is 3D, you can visually check the difference of the analysis result from various angles.
Accordingly, the confirmation time is shorten and users are able to clarify the analysis report regarding the examination before/after the design change, the examination of the mesh specifications, the solver performance investigation, etc.

※You can compare models with different shapes. Therefore, it can also be used for studying design changes.
※This product is an optional function that starts on the general-purpose CAE Jupiter Pre-Post. Extra package installation is not required.
※This product will be released on Jupiter V5.

Features

01
Create a difference contour model just by selecting the analysis results
It is a simple operation that the comparison calculation is executed by the result selection and the difference contour model is automatically created.
The above process is very fast, with less than a second at 5 million nodes.
02
Rich interfaces
Supports all solver results that can be imported by Jupiter-Post.

■ Abaqus, ADVC, Ansys, MSC Nastran, NX Nastran, LS-Dyna, Actran, Recurdyn, PERMAS, MARC, SunShine
03
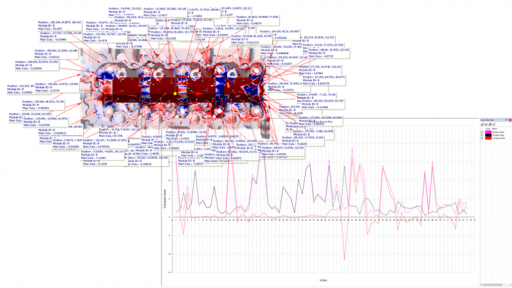
Label display and graph display of arbitrary points
Labels can be displayed and graphs can be created by selecting any point in the comparison contour model.
04
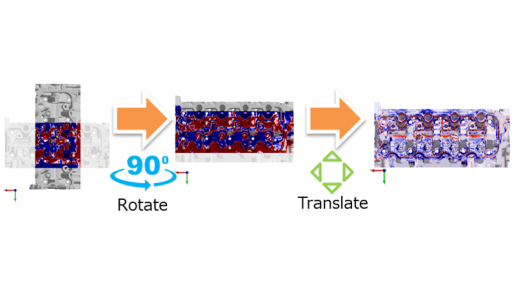
Alignment of result models with different coordinates
Even if the coordinates of the result model are different, the result model can be aligned.
In the above figure, two results are superimposed by rotation and translation.

Operation Example

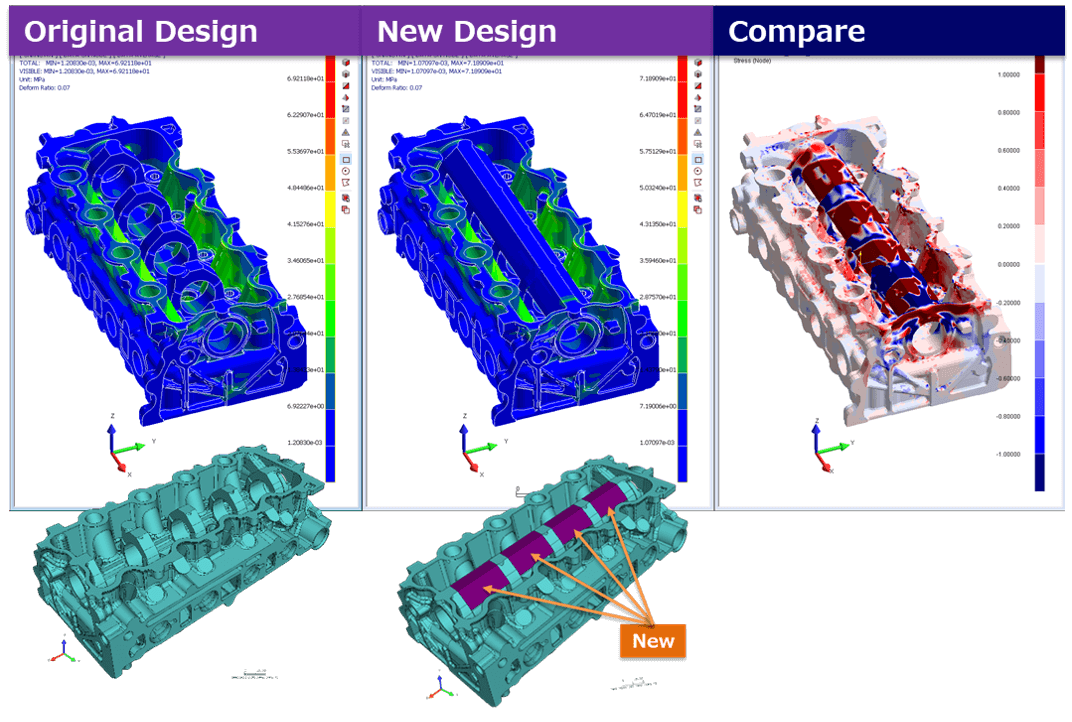
【Design study】Compare the before/after results due to design changes

Head block analysis result (stress) comparison: original design vs new design
You can compare models with different shapes. Therefore, it can also be used for studying of design changes.

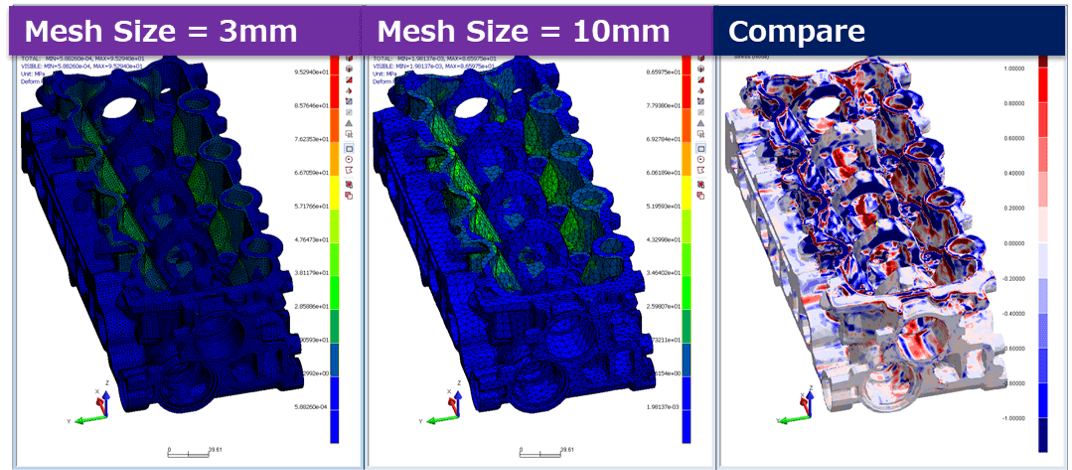
【Examination of mesh changes】Comparison of analysis results of coarse mesh and fine mesh

Head block analysis results (stress) comparison: mesh size 3 mm vs mesh size 10 mm
The tendency of the result is the same, but if you magnify the error and check it, you can see the difference of the result around the crankshaft.

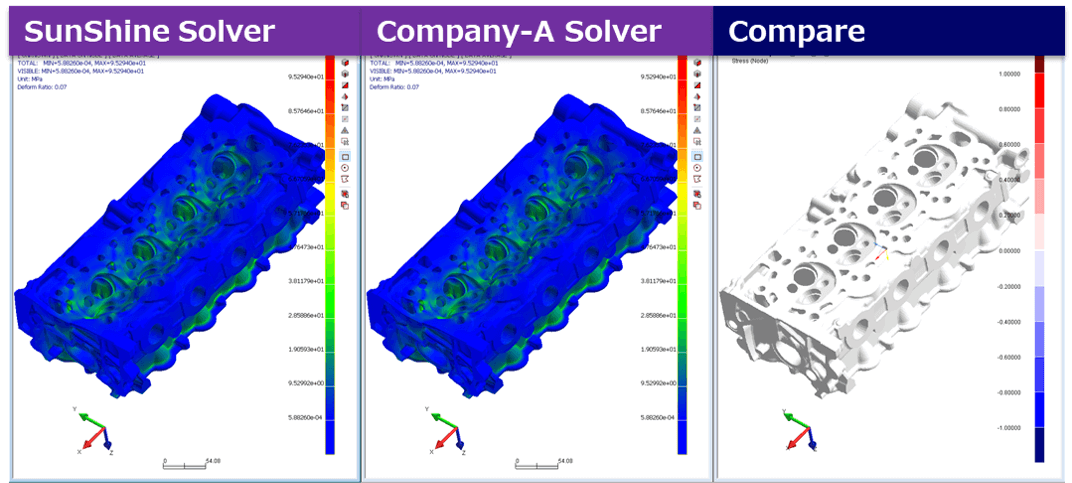
【Solver performance survey】Compare the analysis results of different solvers with the same mesh model

Head block analysis results (stress) comparison: SunShine solver vs. A solver
We have confirmed that the analysis results of our SunShine solver are not different from the analysis results of other solvers.